slide 1 of 1

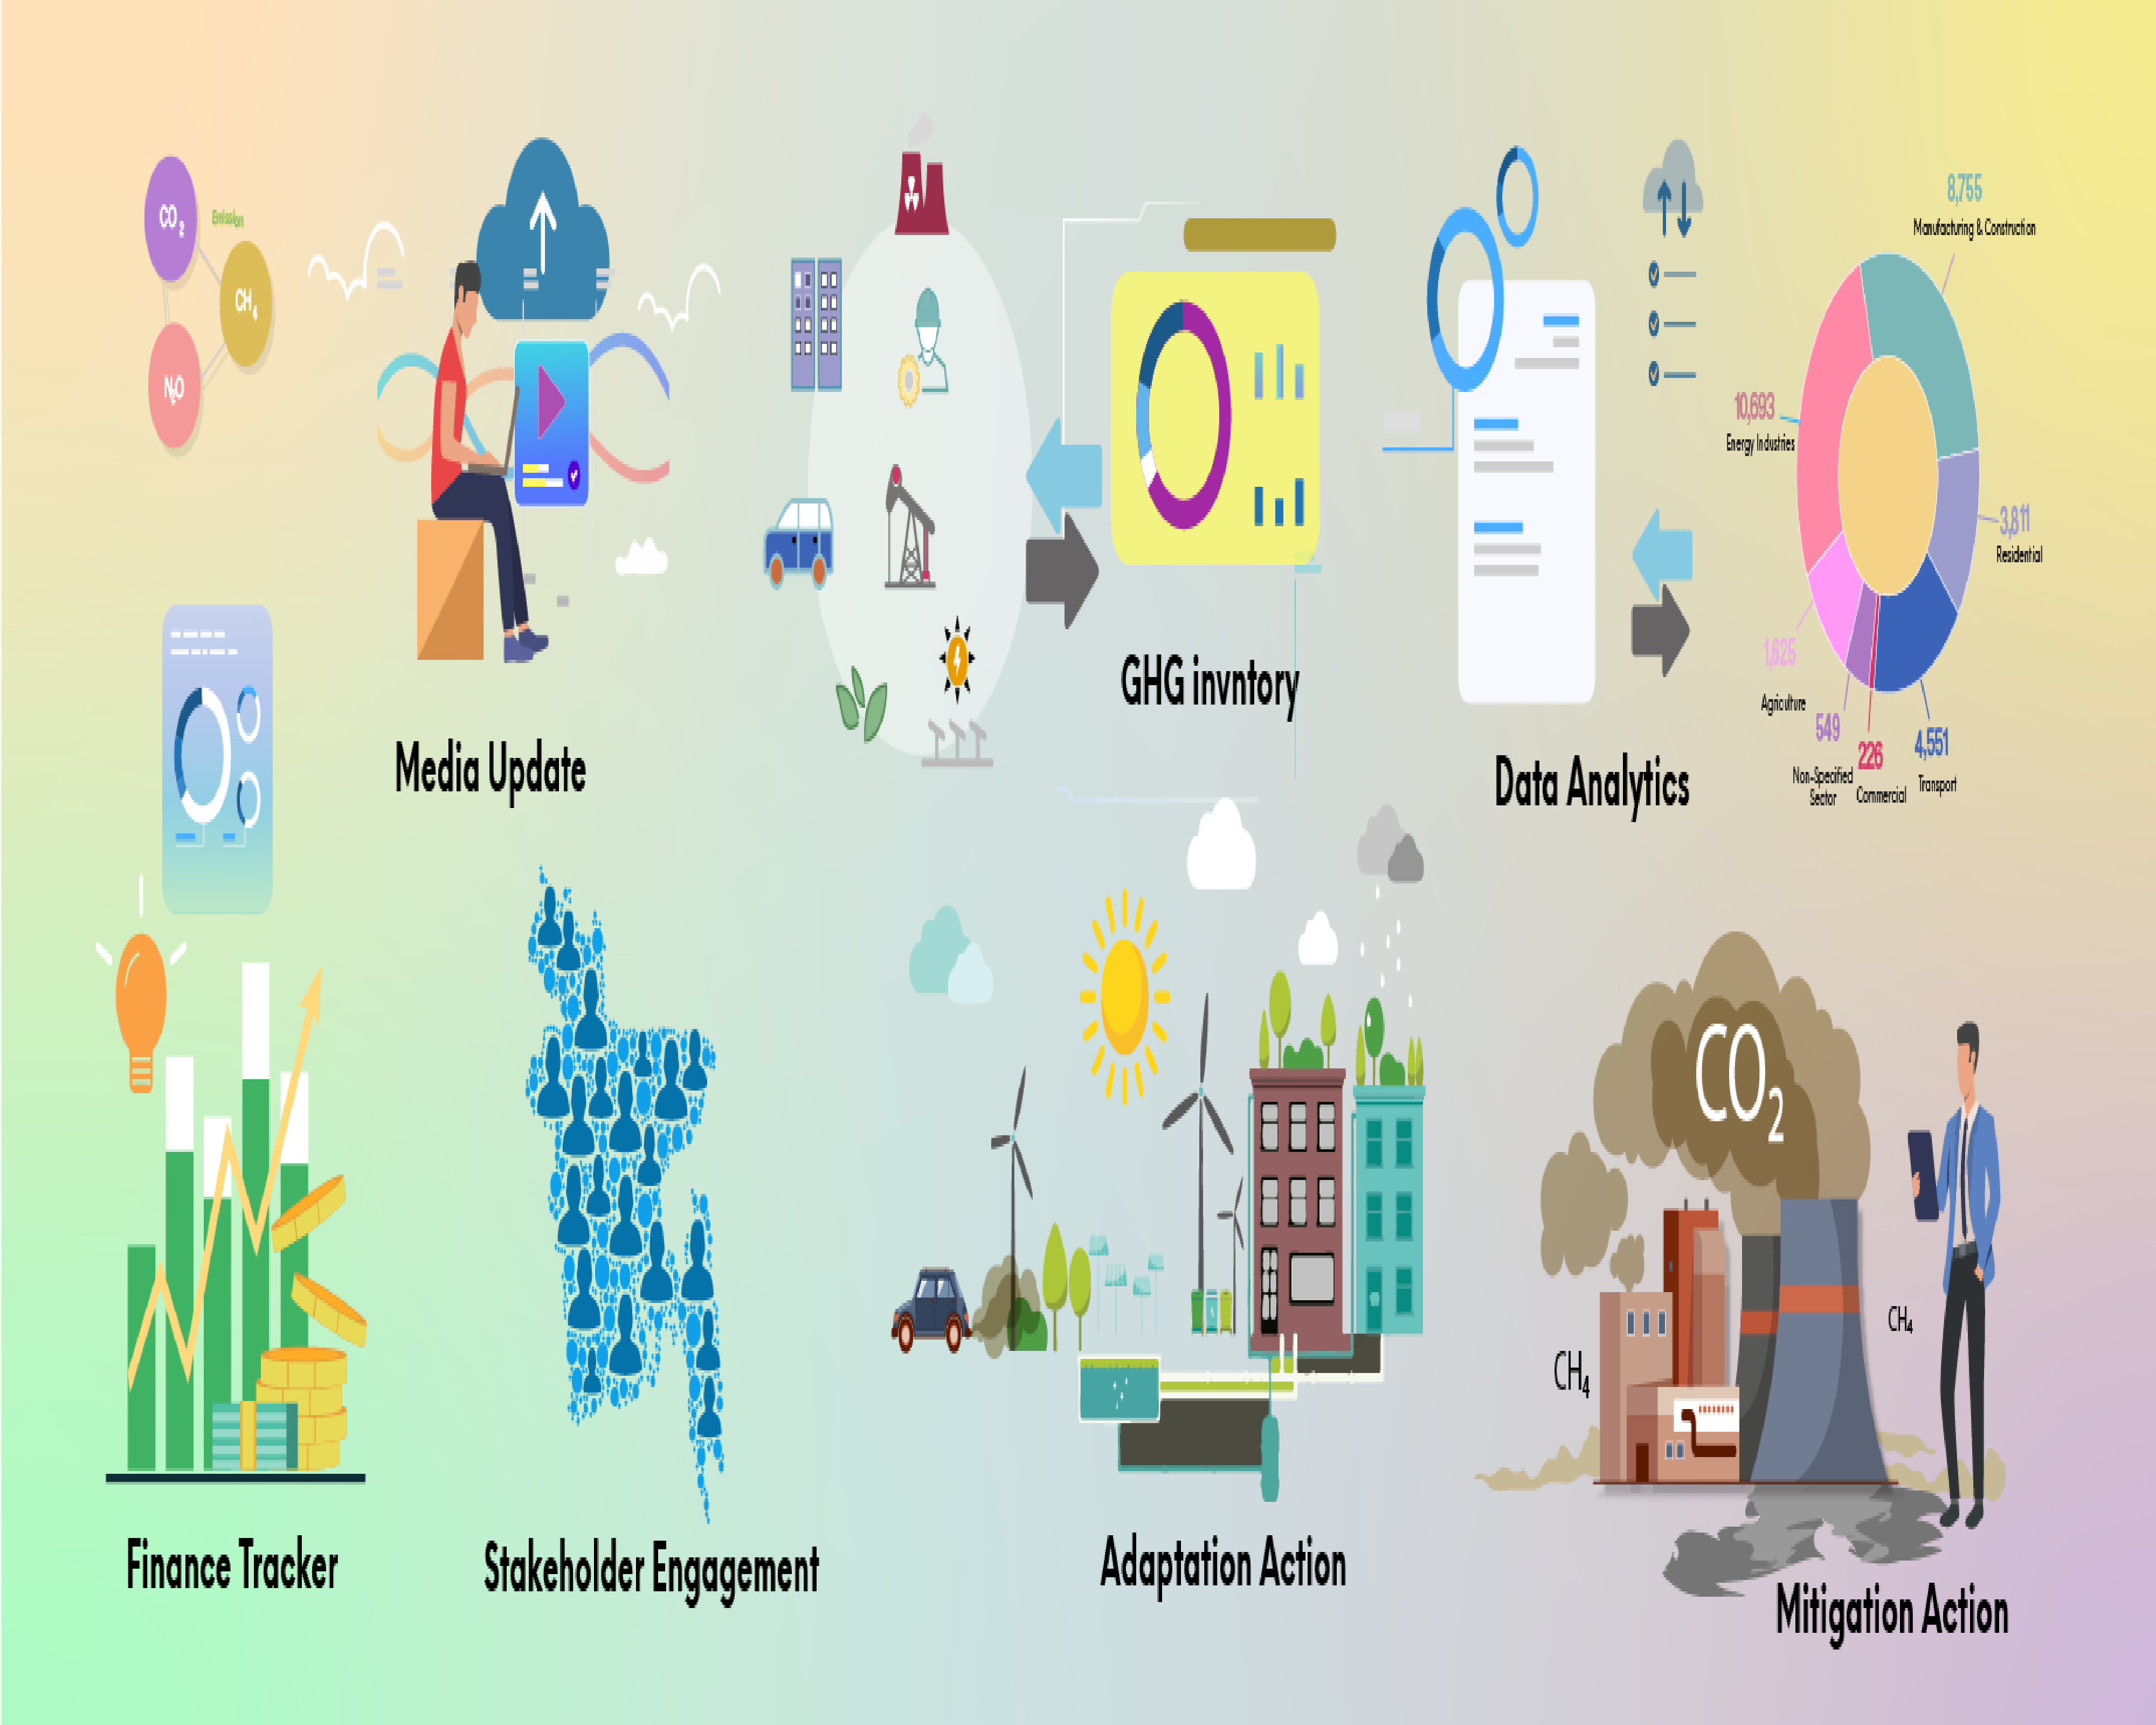
Greenhouse Gas Emission At a Glance

Total Emission

Energy
AFOLU
IPPU
Waste
2013201320142014201520152016201620172017201820182019201987.7790.5997.33104.22105.34111.57115.2666.3967.5169.2270.3469.8171.8472.6417.5518.0918.619.1519.7720.421.04250.00250.00200.00200.00150.00150.00100.00100.0050.0050.000.000.00
Download SVG
Download PNG
Download CSV

Emission from Energy Sector

20132013201420142015201520162016201720172018201820192019120.00120.00112.00112.00104.00104.0096.0096.0088.0088.0080.0080.00
Download SVG
Download PNG
Download CSV

Emission from AFOLU Sector

2013201320142014201520152016201620172017201820182019201974.0074.0072.0072.0070.0070.0068.0068.0066.0066.00
Download SVG
Download PNG
Download CSV

Emission from IPPU Sector

201320132014201420152015201620162017201720182018201920194.604.604.014.013.423.422.832.83
Download SVG
Download PNG
Download CSV

Emission from Waste Sector

2013201320142014201520152016201620172017201820182019201922.0022.0021.0021.0020.0020.0019.0019.0018.0018.0017.0017.00
Download SVG
Download PNG
Download CSV

Latest Activities

FAO MRV
Recent Events
Read More
FAO MRV
Latest Publications
Read More
FAO MRV
Latest Blogs
Read More

Get Our Newsletter


In collaboration with

FAO MRV
FAO MRV
FAO MRV